
Microsoft Power BI recently released two new features—App Audiences and Comparison Calculation Measures.
We’ve been using them for a few months and love how they streamline and simplify content distribution and DAX. Let’s take a look at these latest features in Power BI.
Power BI New Feature: App Audiences
This multiple audiences feature allows you to customize your Power BI applications to share different content with various user groups within a single app or workspace. Additionally, you can track who sees what information to manage access control and enhance data security.
You can control which content artifact (i.e. reports, dashboards, external links, etc.) is accessible to which audience groups. The feature allows you to set granular access permissions, streamline content distribution, meet different reporting needs, and minimize operational overhead.
To Create Multiple Audiences in Power BI:
- Register your app using the Setup tab.
- Add content artifacts in the Content tab.
- Create and manage your audience groups in the Audience tab.
You can have up to 10 audience groups within an app and use the Manage Audience Access pane to add users to an existing audience group.
Power BI New Feature: Comparison Calculation Measures
This group of new DAX functions includes OFFSET, WINDOW, and INDEX. They allow users to perform Excel-like SQL calculations directly on Power BI visualizations with time intelligence. You can interact with the visuals and see the outcomes immediately in context.
These functions allow you to compare data in a specific period with the time before or after it without coding skills. OFFSET retrieves results using relative positioning, while INDEX does so with absolute positioning. Meanwhile, WINDOW returns a slice of results using absolute or relative positioning.
OFFSET
The OFFSET function helps you compare values against a previous one. It allows you to use a Power BI visualization as a cellular table reference without writing code. You can also pull out calculations for further analysis.
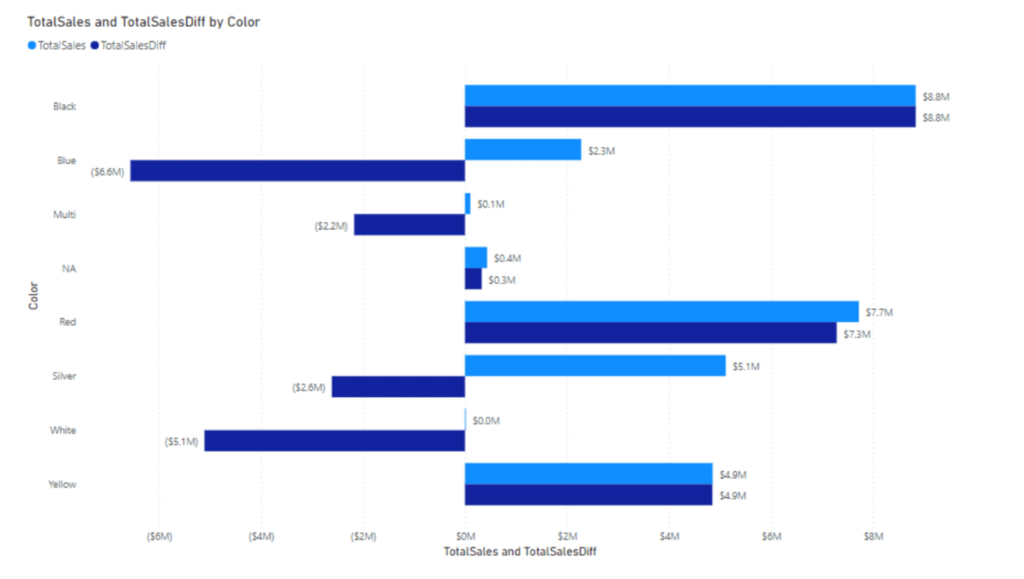
An example of using OFFSET to compare a value against a previous one.
Source
Instead of worrying if you typed in the correct calculations, you can see the numbers on the screen along with the visuals to verify their accuracy. OFFSET is a welcome addition for Excel users who may be intimidated by writing new DAX formulas and worried about making mistakes that could take hours to troubleshoot.
WINDOW
The WINDOW function allows you to perform time-based calculations, such as rolling averages, cumulative averages, moving averages, running sums, etc., that rely on selecting a range of values (e.g., a timeframe of three months.)
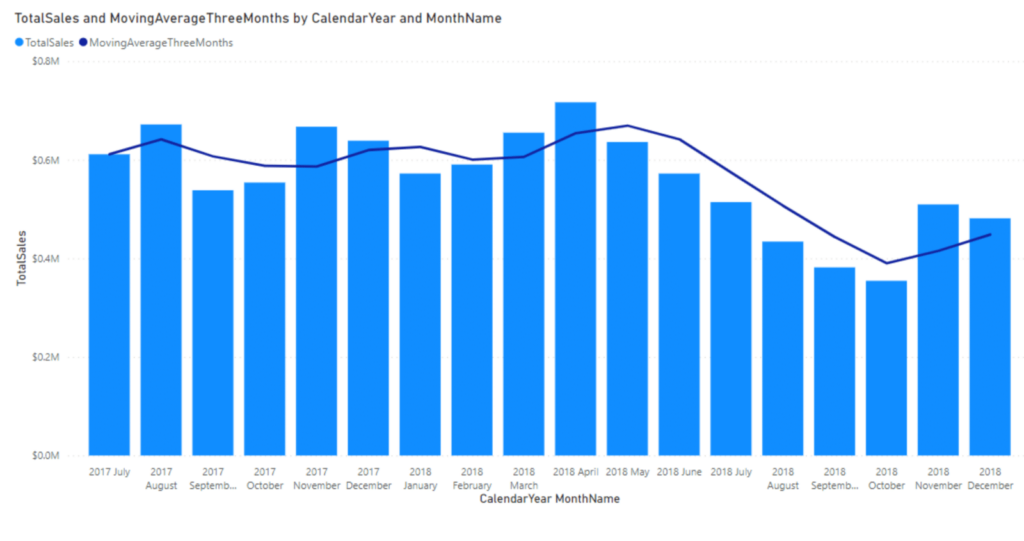
An example of using WINDOW to calculate the moving average.
Source
WINDOW introduces an Excel-like experience with a cellular table-like interface to make performing such calculations less confusing. Instead of writing a complex DAX statement, you can accomplish the same goal with a simpler one. You can also specify custom periods beyond the standard day calculations (i.e. months or quarters.)
INDEX
The INDEX function allows you to simplify tasks and support various transformation patterns by adding explicit position values using the index column command. You can also perform multiplications, divisions, etc., to compare calculation measures against a baseline or other specific entries.
Make the Most of the Latest Power BI Features
Microsoft is constantly adding new features to Power BI to meet evolving analytics and reporting needs. But to get the most out of Power BI, your team must know how to use it.
Enterprise teams trust our Power BI training to help them expand their skills and stay up to date with the latest features. Our immersive, hands-on approach ensures your team learns how to implement Power BI effectively in your organization.
Learn more and get in touch to see how the Collectiv team can help.