
Many organizations searching for a data management, visualization, and analysis solution have heard of Microsoft Power BI.
As a leading solution in the software space, many enterprise teams already know that Power BI presents transformational opportunities for their industry. But, in many cases, they’re still not quite sure how it works.
Power BI is a powerful program with a wide range of capabilities. And although it’s very popular, it’s often daunting when a new user hops in. It’s not just one tool—it’s many tools combined into one high-powered toolset.
Over the years of supporting enterprises with Power BI deployment and adoption, we’ve found that almost all of our meetings inevitably start with the same fundamental question: “What the heck is Power BI, and what can I do with it?”
No one wants to implement a solution they don’t understand. Let’s make sure your team understands:
- What Power BI is
- Power BI Benefits
- Why Power BI is Important
- Power BI Licenses
- How Power BI is Different From Excel
- Tableau vs. Power BI
- How Power BI Works
- The Best Way to Learn Power BI
What is Power BI?
Microsoft Power BI is a collection of software services—an “umbrella” of technologies, apps, and connectors—that work together to help your organization better collate, model, and interpret its data.
These services allow organizations like yours to aggregate data from multiple sources, transform that data into visualizations and reports, and easily discover actionable insights.
Many enterprises have large volumes of data at their disposal. But without the right tools, they don’t have an easy and reliable way to manage, analyze, and report on that data. Enter Power BI.
Power BI Benefits
Power BI saves organizations time and resources by streamlining data analysis, visualization, and reporting processes. These tools offer timely data for business leaders to view in customized dashboards, which display tiles that connect to relevant reports for further analysis.
Dashboards and reports connect to datasets that bring all the relevant data together in one place, allowing leaders to view actionable insights at a glance and make decisions faster and more accurately.
Additionally, robust data modeling and data normalization allow almost anyone to build reports and gain insights from your organization’s data using Power BI, even if your users aren’t professional analysts.
Power BI offers a wide variety of customizable features and tools to give you more control over your data.
Many people already know Power BI as a data visualization tool, but it’s also an ETL tool and a data modeling tool. Microsoft recently released the new Data Marts feature, which gives users the ability to collect their own data and build data sets within Power BI.
Why is Power BI Important?
Power BI is an incredibly important tool for data management and analytics. Here’s why it’s so beneficial for enterprises of all sizes and industries.
Self-Service Analytics
Many organizations struggle to create organized and cohesive internal reports.
Power BI’s data sets support self-service and enterprise analytics. This provides actionable insights for your organization that you wouldn’t get with Excel or other similar tools.
Data Source Connections
Power BI conveniently connects to a wide variety of data sources, including SQL servers, SAP Dynamics, Quickbooks, and more.
This gives your team the ability to take the data you already collect and send it directly to Power BI.
Microsoft Integrations
Power BI is part of the Microsoft ecosystem, which makes it easy to integrate with your existing operations and workflows.
It comes already integrated with the Azure Active Directory, so your team can log in with their existing Microsoft credentials. Not only is this convenient, but Microsoft’s powerful security features are already built into Power BI.
AI Capabilities
Microsoft has recently introduced AI capabilities to Power BI.
These features use AI language models, so users will be able to ask Power BI a question and it will generate a visualization based on that question.
What Are the Licenses in Power BI?
Power BI offers several different licenses to choose from. To decide which one is right for you, consider factors like your organization’s size and budget as well as your data reporting needs and goals.
Here’s an overview of the Power BI licenses and what’s included with each.
Power BI Free
As the name implies, the Power BI Free license is available to anyone at no cost.
This license is designed just for one person to use and has limited features. While it’s not a good fit for most enterprises, it is a great place to start for solopreneurs or individuals who just want to test out the program.
Power BI Free only offers one data refresh per day, and you won’t be able to share or collaborate on reports. It’s also lacking some popular features from the paid licenses.
Power BI Pro
This is Power BI’s first tier of paid licenses, and it is available as part of Microsoft Office 356 E5 enterprise licenses. It’s also available for purchase individually for $10 per user per month.
This version is much better for collaboration than the free version, as you’ll be able to share your reports and have access to up to 8 data refreshes per day.
Each user gets 10GB of storage and you’ll have a maximum data set size of 1GB.
Power BI Premium
Power BI Premium is a type of paid license for large enterprises that need more data processing power and advanced features. This power does come with a large price tag, starting at about $5,000 per capacity every month.
We recommend these licenses for enterprises with over 500 Power BI users.
There are five premium P SKU licenses available, which vary in terms of price and overall power. Microsoft has recently adjusted these licenses to autoscale to meet your organization’s computing needs.
These powerful SKUs provide 100 terabytes of storage and 48 data refreshes per day, in addition to other advanced features.
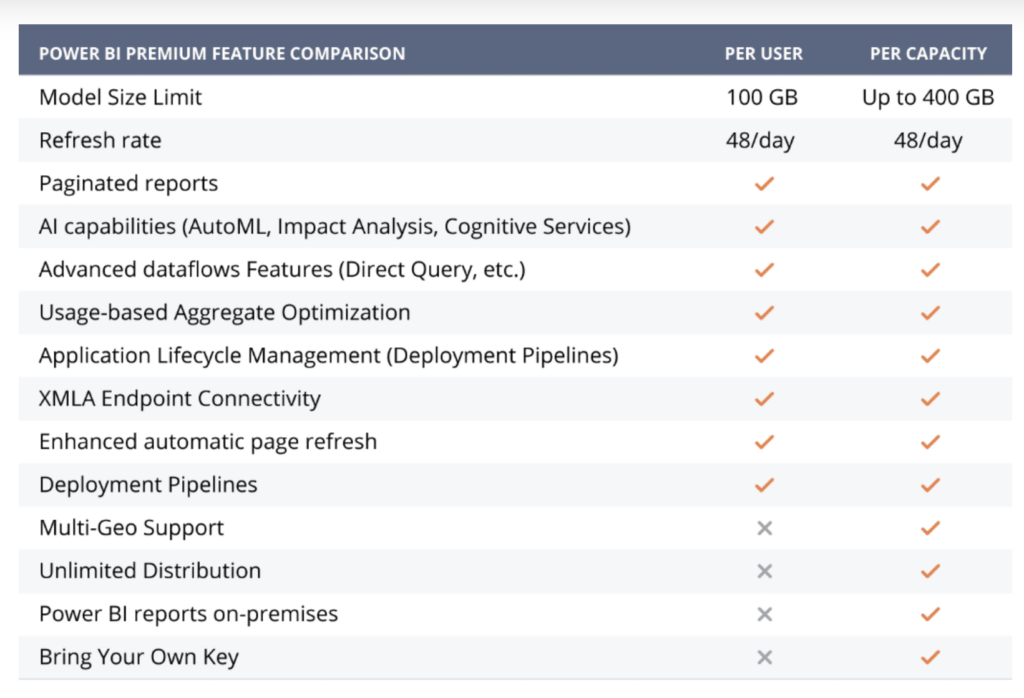
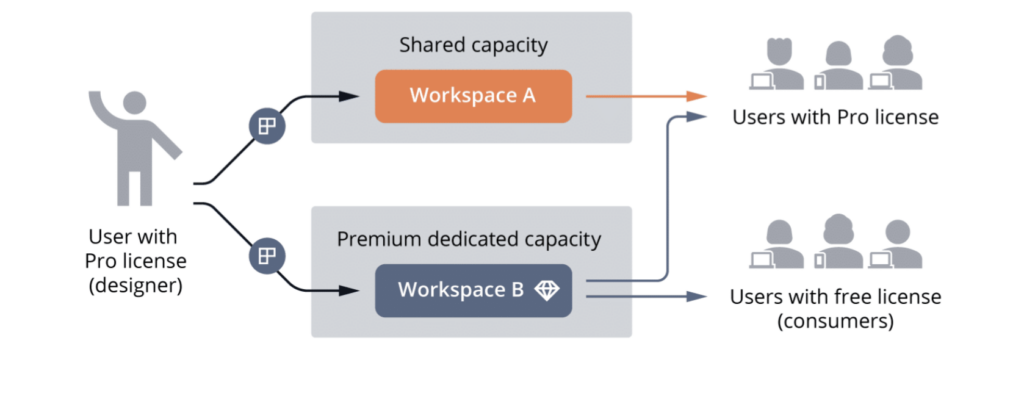
Power BI Premium Per User
The Power BI Premium Per User license is a great way to gain access to more powerful features on a tighter budget. This relatively new option costs $20 per user per month.
While this is more expensive than a Pro license, it gives your users access to most Power BI Premium features. Users with a PPU license will be able to create, access, and share reports in PPU workspaces. You just won’t have some advanced features such as access to Power BI Report Server (on-premise reporting).
This is a good middle-ground option for organizations that aren’t quite ready for a Premium per-capacity license but still need access to some Premium features.
Power BI Embed
Power BI Embed is a subset of the Premium license category. As the name suggests, these licenses allow you to embed Power BI reports in Teams, SharePoint, or even web applications.
This option is worth considering if you need to send your reports to a large volume of end users that don’t already have their own Power BI Pro licenses. Anyone can view embedded reports generated with a Power BI Embed license.
Is Power BI the Same as Excel?
Power BI (.pbix) files look very similar to Excel files but have a few key differences.
The biggest difference is that Power BI automatically pulls data from connected datasets to refresh your analysis in real time, which is something you’d have to do manually in Excel.
Luckily, if you’re familiar with Excel, you’ll already know some Power BI tools, such as Power Pivot and Power Query.
Power Query works very similarly in both Excel and Power BI. However, Power Pivot features are integrated natively into Power BI. You’ll be able to build the same data models and relationships you would build in Power Pivot directly in the Power BI desktop.
Power BI files are structured differently than Excel files. Every .pbix file contains three layers that help users analyze their data:
1. Power Query
Power Query is an Extract, Transform, and Load (ETL) tool accessible directly through Power BI Desktop. This tool allows users to connect internal and external data sources, manipulate the data, and structure them into a data model to create a Power BI file.
Users save substantial time gathering data for reporting with this tool; plus, it simplifies future reporting by remembering previous instructions and using the same search to refresh results.
2. Data Model
Power BI Desktop lets you quickly structure any data into easy-to-read tables.
Tables are combined using one-to-many relationships to create data models, which answer complicated questions through rapid calculations and analysis updated in real-time.
3. Visualization
Power BI files make it simple to present and manipulate different data through visualizations. These visualizations help tell the story of your gathered data, offering robust interactive reporting capabilities.
Power BI also integrates with Excel, so it’s possible to use the two programs in tandem. Users are able to connect Excel directly to the data models they create in Power BI and build Power Pivot tables from that data.
Should I Do Tableau or Power BI?
We’re huge fans of Power BI here at Collectiv, but you might be considering other data visualization tools like Tableau as well. Power BI and Tableau are the two most prominent tools in the data visualization market, and they have very similar features.
Both of these tools have their own strengths and weaknesses. Every organization is unique, so you’ll need to evaluate your IT strategy and determine which tool best fits your needs.
If your team is already using the Microsoft 356 ecosystem of products, Power BI is an excellent choice because it integrates directly with systems you’re already using, including Azure.
To get started, you’ll need to assign Power BI licenses to your team members. You can also get started directly with a Power BI free license.
How Does Power BI Work?
Although Power BI has many complex features, building your first report only takes a handful of minutes.
Here’s a step-by-step overview of how to build a report with data sources you already have.
- Start by choosing your first data source. In our example, we used a CSV file with a sales table. Power BI will show you a preview of the data.
- Once you’ve uploaded your first data set, click “Transform Data” which opens Power Query. Here, you’re able to transform your data before putting it into your final model. This gives you the opportunity to change or add columns, update your data types, merge sources, and more.
- Once you’ve done this with your first data source, you’ll need to repeat the process with a second data source. In our example, we selected another CSV file with a product table. Transform the data and make any necessary adjustments in Power Query.
- Next, close Power Query and select “Apply”. This loads all of your data into your new Power BI data model.
- The first step here is to evaluate your relationships between the data sources. Power BI can auto-detect relationships between specific data columns, but you have the option to change them or add relationships manually. To do this, drag and drop a column from one table to its related column in the other table. In our example, we created a relationship between the “Product Key” columns.
- Now you’re ready to create your report. Start by giving it a title. You won’t be able to type directly on your Power BI report. You’ll need to add a text box to create the title and adjust the font, size, and location.
- From there, you’ll want to create your visualizations. When choosing visualizations, consider what would be most helpful for the end user. There are many different types of visualizations you can build and modify within Power BI. In our example, we started with KPI cards and then added matrix and bar chart visuals to reflect them.
Is Power BI Hard to Learn?
Many people are already familiar with Power BI as a visualization tool. From this perspective, Power BI is relatively easy to learn. If you are already familiar with the Microsoft ecosystem and are comfortable dragging and dropping visual components, you’ll be able to create a visual data table.
However, Power BI is so much more than just a visualization tool.
Features like ETL and data modeling tools make the program more robust, but they also have a sharper learning curve. Publishing Power BI reports and deploying them to your end users gets even more complex.
These additional features are worth taking the time to learn despite their complexity, as they bring so much more value to your organization.
Ready to learn Power BI from the experts? We’re here to help you master even the most complex aspects of this tool by taking the struggle out of learning Power BI.
Collectiv’s expert consultants listen to your specific needs and provide both group and one-on-one training sessions to help you effectively use Power BI. During workshops, we help you build automated Power BI reports and experience the aha moments of getting the right answers to your toughest problems.
Learn more Power BI training details here and reach out to Collectiv as soon as you’re ready to sign up your team for a training session.